Food for Thought
It was over 20 years ago, around 8 pm. Three Business Analysts and two fellow coders
crowded around my desk with the sinking realization that it was going to take an
all-nighter to pull off our deliverable. Just then, the senior PM poked her head
in with a concerned look and a "What can I do to help?" We shot a round
of blank looks at each other, but before we could even formulate a polite reply,
she nodded quickly, and said: "Right: I’ll go get some food."
Surely, figuring out what the team needs to keep them going efficiently is one of
the most important skills a PM can offer.
But what happens when your team’s Online Project Management itself
isn’t keeping up? The prospect of assessing the performance of sophisticated
Web-based PPM Software is pretty daunting, even if you are a technical PM.
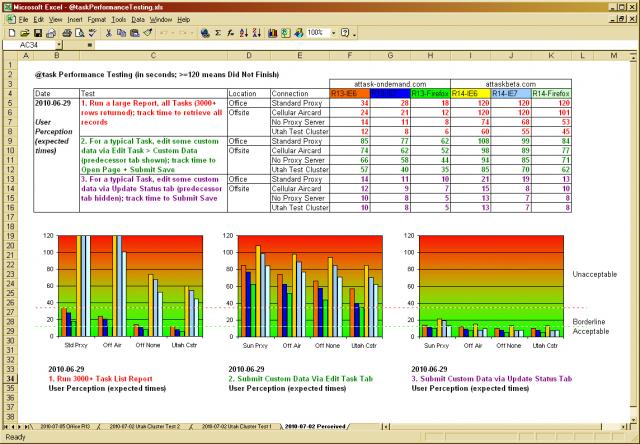
This spreadsheet can help you performance test your On-Demand Project Management
environment and keep your team going:

Peek Performance
The spreadsheet has several practical features:
- a cell (B2) of the maximum allowable time for any test (e.g. 120 seconds)
- a cell (B5) to define the Date and Reason for the tests
- a column (C) to define and describe three tests
- a column (D) to define two physical locations for each tests (e.g. Office, Offsite)
- a column (E) to define four different types of connections (e.g. LAN, Proxy, etc.)
- a grid (F3:K16) to record the results of the tests across two environments and three
browsers
- three graphs — one per test — with fixed Y-axis scales that illustrate
the test results
- two lines across all graphs dividing acceptable, borderline, and unacceptable performance
You too can take your own Performance Testing. Download the
spreadsheet, update the ranges above to suit your tests, and then each time
you want to test:
- duplicate the tab and date it
- update the Date and Reason (B5)
- clear the results grid (F3:K16)
- run the tests and enter the new results (F3:K16)
- use the tabs to "flip" between the tests, effectively animating the graphs
The performance tracking spreadsheet is simple to use and easy to understand. If
certain aspects of your Project Management Software are not running as quickly as
your team needs them to, you — as PM — can take the initiative to quantify
what’s really happening, initiate a solution with your vendor, and keep your
team going efficiently.
But food’s always appreciated, too.