Gravity: it’s not just a rule. It’s the law.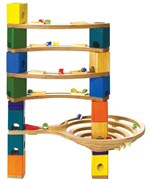
There’s a tactile satisfaction to the way a wooden marble run game plonks
steadily from top to bottom. At a glance, we recognize the path. As it runs, we
appreciate the steady pace. And at the end — plop! — we know with certainty
it’s reached its goal.
Wouldn’t it be great if Project Management Software worked the same way?
Become a Mogul Mogul
At the 2010 Workfront User conference last month, gold-medal winner Johnny Moseley shared
a very cool video of his dry land
training, hopping down a dusty hill with ski poles at incredible speed.
In a somewhat tenuous stretch, that impressive rhythm is also the end goal of the
Switchback Workflow concept that I introduced in my Four Webthings and a Funeral
presentation.
This screenshot illustrates how it works:
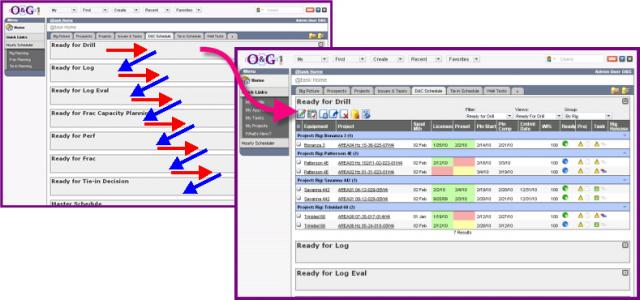
The Switchback
The left side shows is a series of collapsed reports on a single web page.
Each report represents a major phase through which each Project being tracked will
pass on its way to completion. As each phase is passed, users can see their Project
based work progressing as it switches back and drops down to the next report.
The right side zooms in on the first report to show some standard concepts. The
first few columns identify the Projects in chronological order. Next are some colorized
dates, with green for those that are complete, yellow for those due within the next
14 days, and for those due red within the next 7 days. Then there are some icons
— a circular traffic light showing data readiness, a column for the overall
Project status, and another for the specific Task status. The final column is always
blank; but it serves to define what data has to be provided to drop down to the
next report.
Another Angle
The cool part about this approach is that it’s so generic: any phased data
can displayed using this approach. As a bonus, if you imagine tipping the phased
reports a quarter turn to the left, the data can also be displayed graphically using
the
Big Picture chart that I shared in my last post. Think of this Switchback
Workflow as the drilldown version of the data that drives the chart.
The next time you’re deciding the best way to share work management information
with your team, I hope you’ll consider this approach. It’s helped us
keep on track, without losing our marbles.